Export trend analysis for Indian exports - Sept 2023
Monthly aggregate merchandise exports provide a snapshot of India's economic health and the global market. While it's tempting to draw conclusions from this data, I'd caution against it unless we're observing broad patterns. For impactful policy decisions, a deeper dive is essential, albeit with some delay due to data lag.
Now, let's venture into this intriguing data analysis.
Here's the latest monthly exports figures, in USD billion dollars, for merchandise exports from India:
| Month | Trade Balance | Total Exports | YoY growth | Exports minus POL | YoY growth |
| Apr-22 | -18.4 | 39.7 | 29.1 | 31.8 | 17.4 |
| May-22 | -22.1 | 39.0 | 20.8 | 30.5 | 13.1 |
| Jun-22 | -22.1 | 42.3 | 30.1 | 31.7 | 11.0 |
| Jul-22 | -25.4 | 38.3 | 8.0 | 30.2 | 1.7 |
| Aug-22 | -24.9 | 37.0 | 10.9 | 28.5 | -0.7 |
| Sep-22 | -28.0 | 35.4 | 4.7 | 28.1 | -1.7 |
| Oct-22 | -26.3 | 31.6 | -11.6 | 25.3 | -16.7 |
| Nov-22 | -22.1 | 34.9 | 9.7 | 26.8 | 1.9 |
| Dec-22 | -23.2 | 38.1 | -3.1 | 29.7 | -8.6 |
| Jan-23 | -16.4 | 35.8 | 1.6 | 28.1 | -8.4 |
| Feb-23 | -16.2 | 37.0 | -0.4 | 29.2 | -3.6 |
| Mar-23 | -18.1 | 41.9 | -6.0 | 33.6 | -3.4 |
| Apr-23 | -15.5 | 34.7 | -12.7 | 28.2 | -11.4 |
| May-23 | -22.0 | 35.0 | -10.3 | 29.1 | -4.6 |
| Jun-23 | -18.8 | 34.4 | -18.8 | 27.6 | -12.9 |
| Jul-23 | -18.5 | 34.5 | -10.1 | 27.8 | -8.0 |
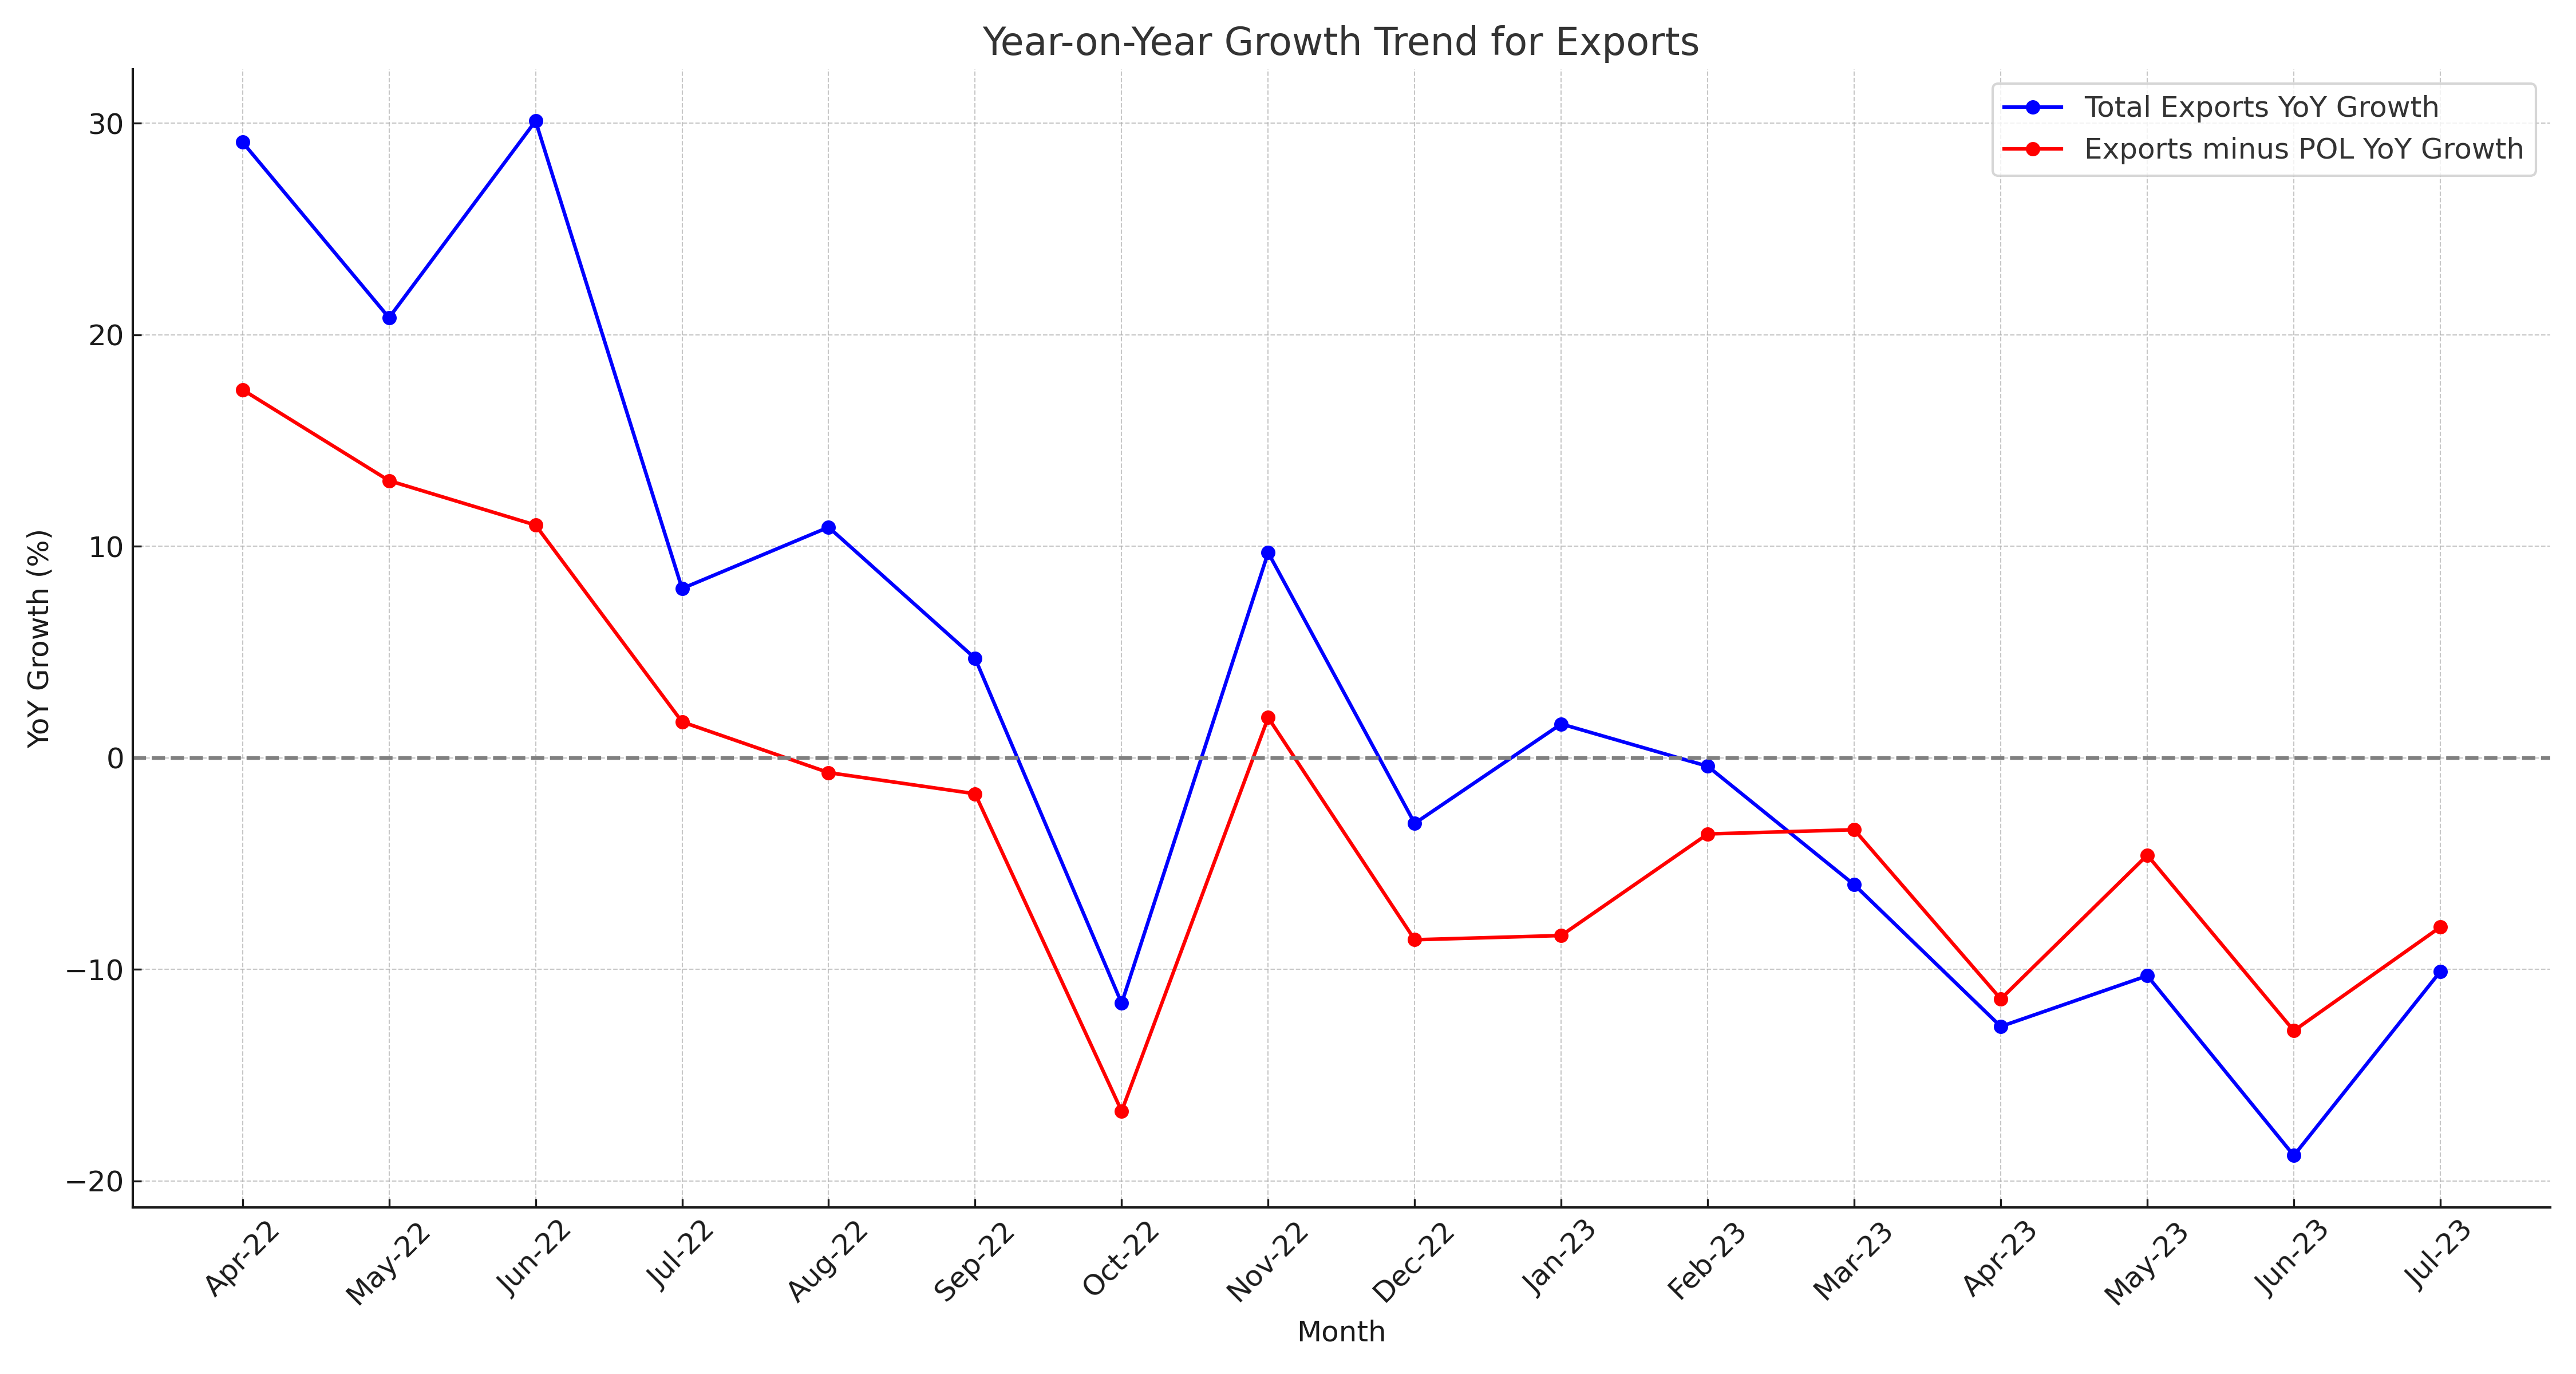
Finally, upon examining India's export data over the past year, a few trends become evident. See the figure below. The bars are the monthly export figures in USD Billion (left side Y axis) and the line is the YoY growth (monthly - right side Y axis). I have covered total and total minus POL for each month.
The most striking is the downturn in the Year-on-Year (YoY) growth rates observed in the recent months. This trend is influenced significantly by the base effect, a concept well-understood in economic analysis. Last year, India achieved record-breaking export figures. When this year's data is compared against such high benchmarks, the performance, although commendable, appears to be waning.An interesting aspect of this trend emerges when we focus on 'Exports minus POL' — that is, exports excluding Petroleum, Oil, and Lubricants. The decline in the YoY growth rates for this metric is somewhat less pronounced than that of the total exports. This disparity suggests that external factors, such as recent fluctuations in petroleum prices, have played a role in shaping the overall export narrative.
It's also worth noting that global economic dynamics, shifts in demand patterns, and supply chain disruptions can influence such trends. While the petroleum sector has shown volatility, other sectors too have had their share of challenges, which might be reflected in the data.
In conclusion, interpreting such data requires a nuanced approach. It's imperative to consider the exceptional performance from the previous year and understand the external variables, like petroleum price dynamics, that could be influencing the current figures.
(The code to generate the above plots are kept at: base_effect_analaysis.py and export_analysis_code.py alongwith relevant excel sheets)


Comments
Post a Comment
Comments are moderated. Your comment will be online shortly. Kindly excuse the lag